ENEM 2023 | Caderno Azul - Matemática
Navegue pelas questões
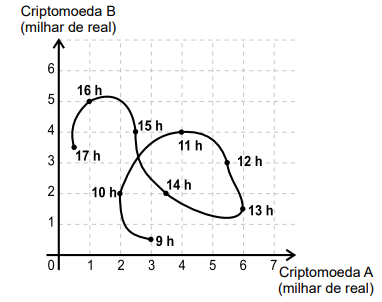 Durante horas consecutivas, esses valores foram observados em nove instantes, representados por horas exatas. Em quantos desses instantes a criptomoeda A estava mais valorizada do que a criptomoeda B?
Analisando as coordenadas aproximadas $(x, y)$ de cada um dos nove instantes representados no gráfico:
$• 9\text{ h}$: $(3\text{; } 0,5) \rightarrow 3 > 0,5$ (A > B)
$• 10\text{ h}$: $(2\text{; } 2) \rightarrow 2 = 2$ (A = B)
$• 11\text{ h}$: $(4\text{; } 4) \rightarrow 4 = 4$ (A = B)
$• 12\text{ h}$: $(5,5\text{; } 3) \rightarrow 5,5 > 3$ (A > B)
$• 13\text{ h}$: $(6\text{; } 1,5) \rightarrow 6 > 1,5$ (A > B)
$• 14\text{ h}$: $(3,5\text{; } 2) \rightarrow 3,5 > 2$ (A > B)
$ • 15\text{ h}$: $(2,5\text{; } 4) \rightarrow 2,5 < 4$ (B > A)
$• 16\text{ h}$: $(1\text{; } 5) \rightarrow 1 < 5$ (B > A)
$• 17\text{ h}$: $(0,5\text{; } 3,5) \rightarrow 0,5 < 3,5$ (B > A)
Os instantes em que a criptomoeda A estava mais valorizada que a B ocorrem às $9\text{ h}$, $12\text{ h}$, $13\text{ h}$ e $14\text{ h}$. Portanto, isso ocorreu em $\boxed{4}$ desses instantes.